elwood-spatial
Information-theoretic outlier detection for spatial networks.
Installation
pip install elwood-spatialQuick Example
import elwood_spatial as es

# Define bins for your measurement domain
bins = es.BinSpec.from_tuples([(0, 50), (51, 100), (101, 150), (151, 200)])

# Sensor readings at a single timestep
values = {"sensor_1": 45, "sensor_2": 120, "sensor_3": 48, "sensor_4": 52}
bin_indices = {k: bins.bin_index(v) for k, v in values.items()}

# Network entropy
entropy = es.shannon_entropy(list(bin_indices.values()))

# Detect outliers
from elwood_spatial.detect import detect_outliers, PARAMS_OPERATIONAL

network = {
    "sensor_1": {"neighbors": ["sensor_2", "sensor_3", "sensor_4"], "weights": [1, 1, 1]},
    "sensor_2": {"neighbors": ["sensor_1", "sensor_3", "sensor_4"], "weights": [1, 1, 1]},
    "sensor_3": {"neighbors": ["sensor_1", "sensor_2", "sensor_4"], "weights": [1, 1, 1]},
    "sensor_4": {"neighbors": ["sensor_1", "sensor_2", "sensor_3"], "weights": [1, 1, 1]},
}

results = detect_outliers(values, bins, network, PARAMS_OPERATIONAL)
# => {"sensor_1": False, "sensor_2": True, "sensor_3": False, "sensor_4": False}
How It Works
elwood-spatial uses Shannon entropy and information content to detect anomalous readings in a network of sensors. Measurements are discretized into bins, and a device is flagged when three conditions hold simultaneously:

- The device's measurement carries high information content; it
is surprising relative to its network

- The network has low entropy; neighboring devices are in
broad agreement (ordered network)

- The device's bin classification is sufficiently distant from
the network average in measurement space


This rule-based approach is fast, interpretable, and requires no training data. For ML-based detection, the package also provides feature-engineering utilities for XGBoost or similar models. Read more in the About section.
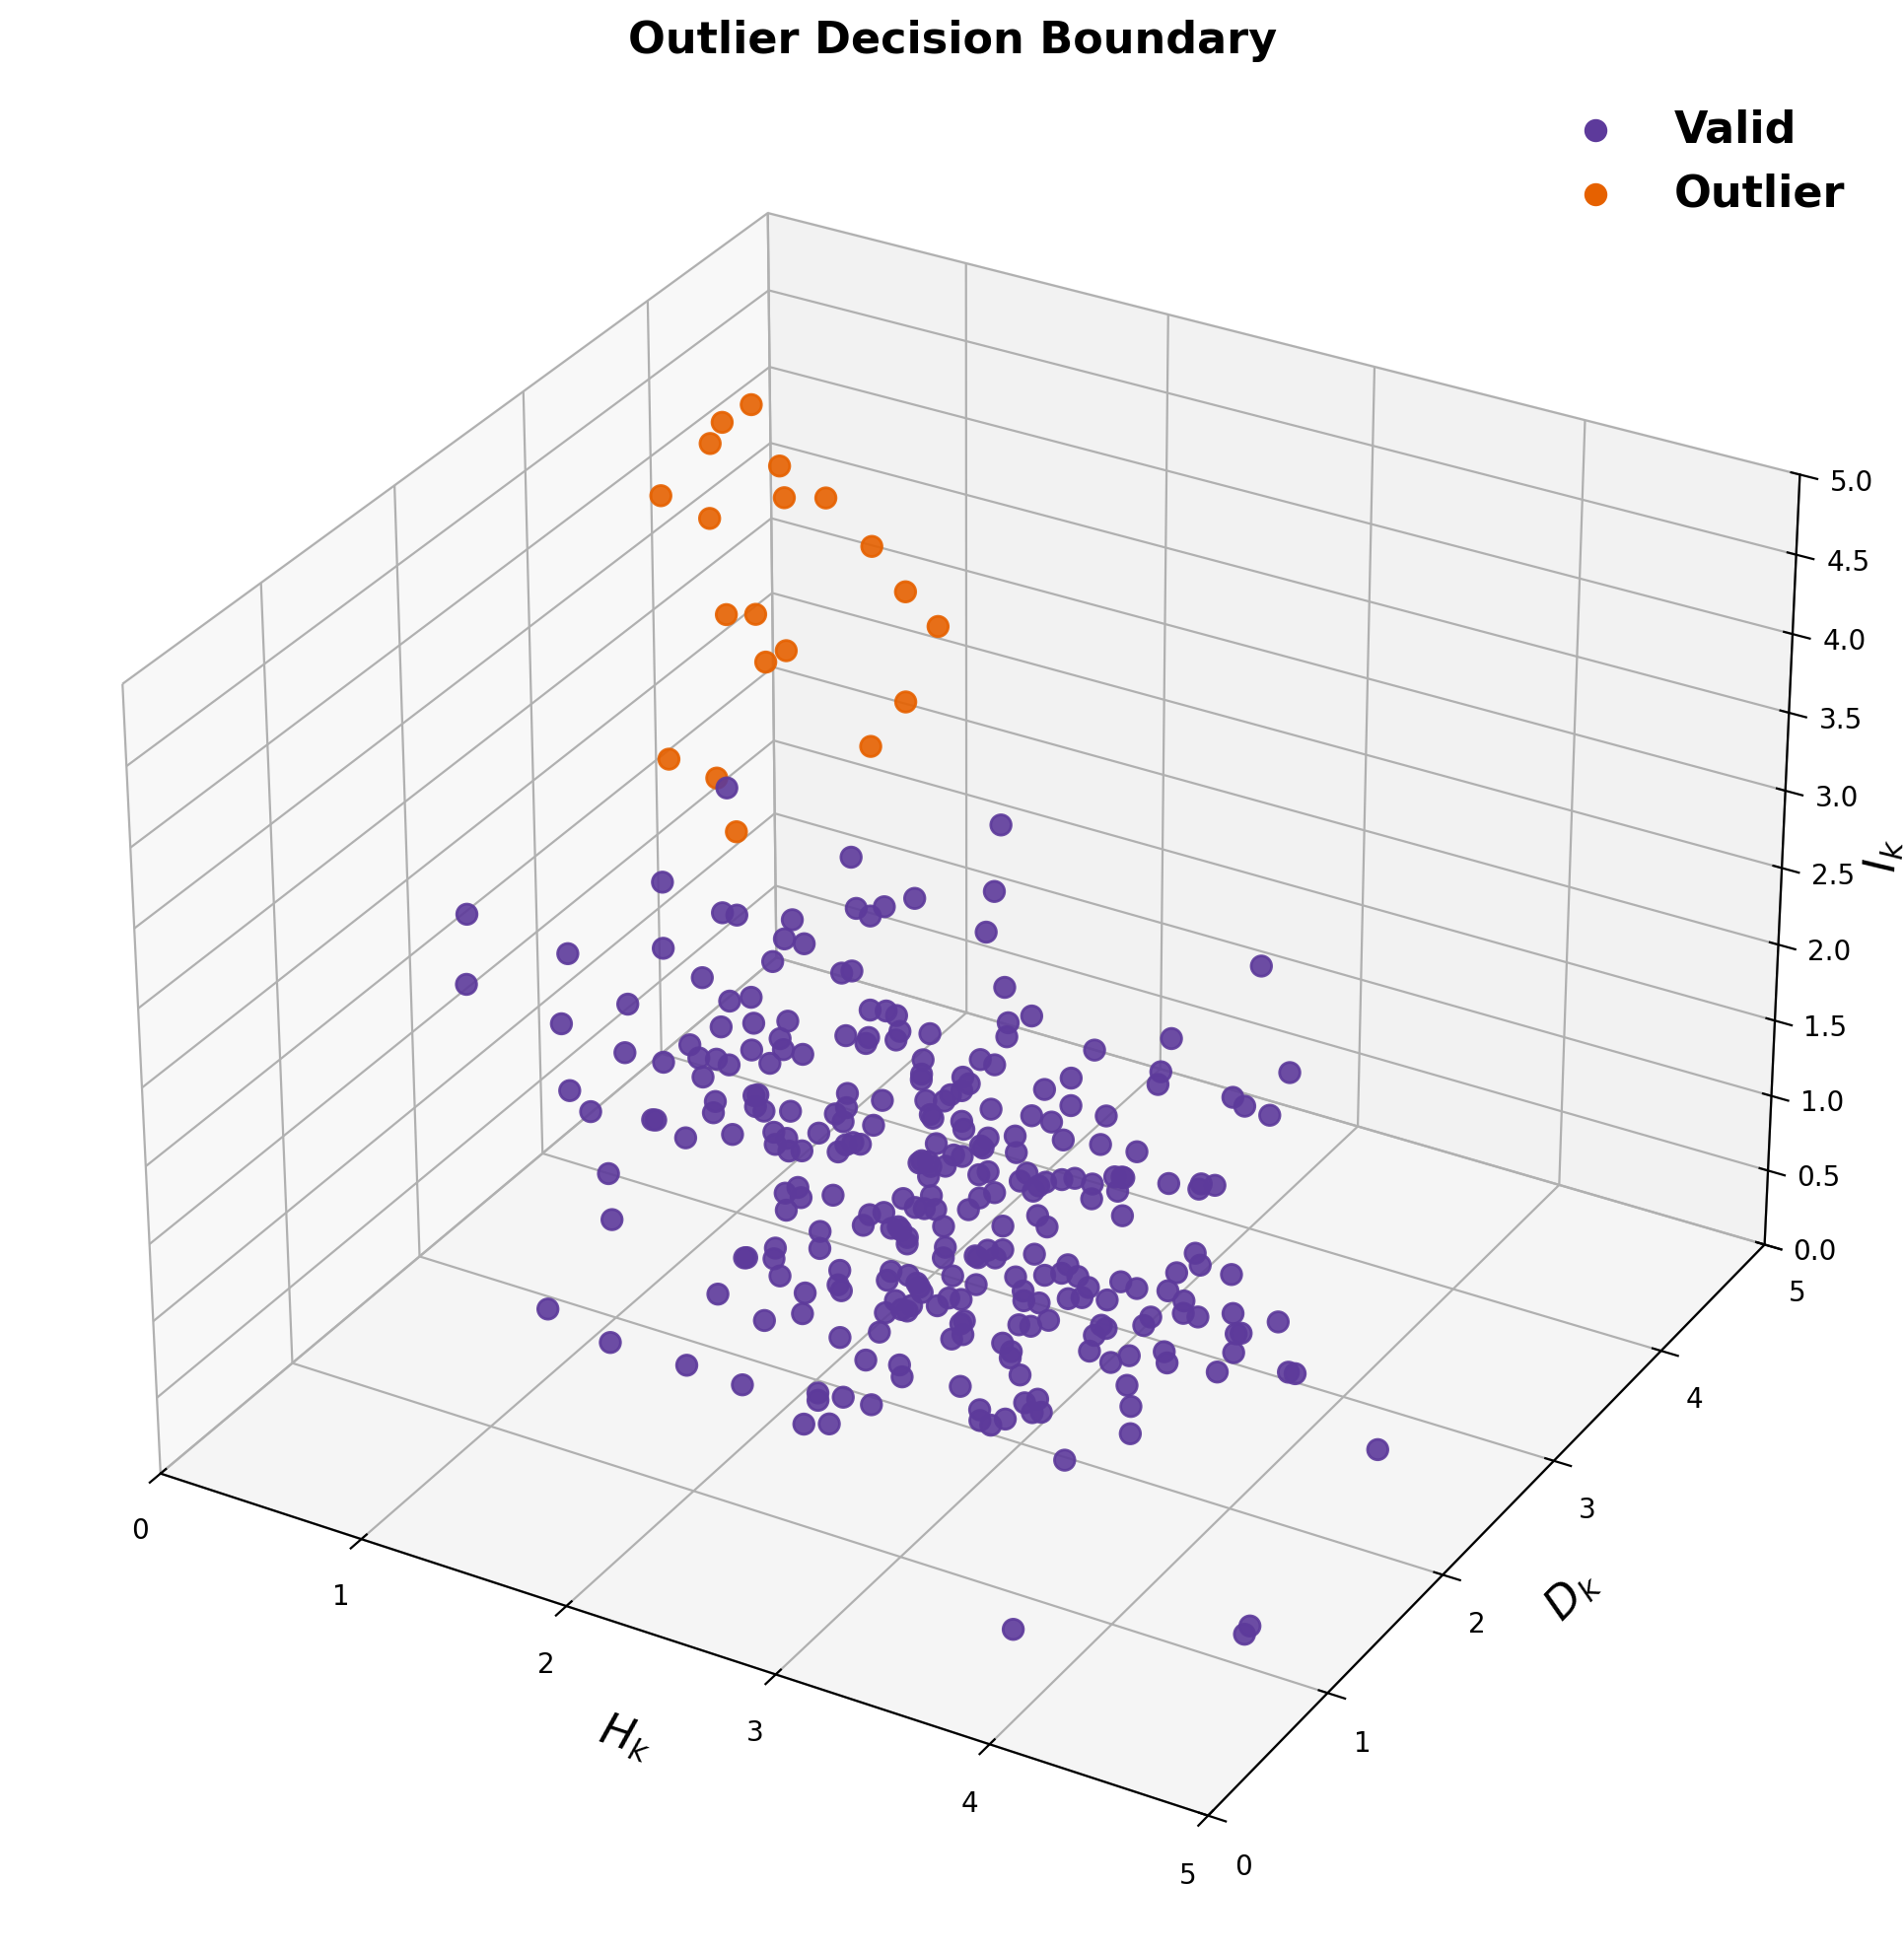
Valid readings (purple) cluster at high entropy and low deviation. Outliers (orange) appear in the high-information, low-entropy, high-deviation region.